
資料視覺化
Data Visualization
進入大數據時代,各行各業都需要與時並進,配合科技的迅速發展,收集數據並對其進行分析。透過參加由淺入深的數據分析課程,學生能對數據整合等進行了解,培養興趣並裝備自己,迎接未來無數機遇。
Entering the era of big data, all industries need to keep up with the rapid development of technology, collect data and analyze it. By participating in progressively deepening data analysis courses, students can understand data integration and cultivate interest, equipping themselves to embrace countless opportunities in the future.
視覺化數據 分析未來走勢及機遇
Visualized Data Analysis - Analyzing Future Trends and Opportunities
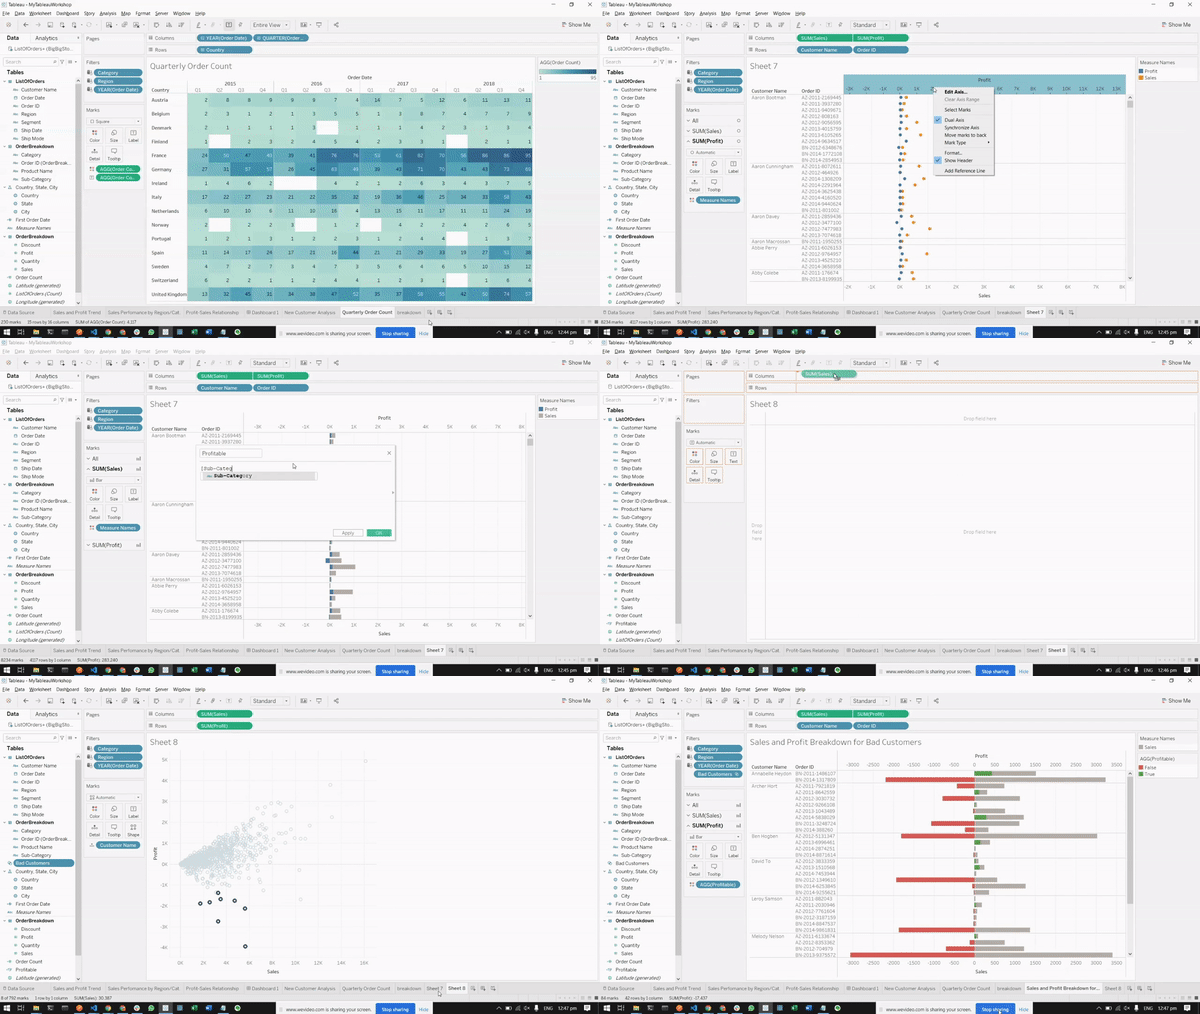
Tableau 介面簡單,容易運用且上手。透過使用 Tableau,學生能夠輕易處理原本雜亂無章的數據,並應用在不同領域上,把數據變得視覺化,從而分析箇中玄機。此外,運用 Tableau 有助學生訓練數據分析能力,還能協助他們解決功課上的煩惱。例如,學生能把 Tableau 應用於專題研習上,有助他們分析數據並和他人分享見解。故學生應及早學習使用 Tableau,裝備好自己,迎接大數據時代帶給我們的挑戰。
Tableau has a simple interface that is easy to use and learn. By using Tableau, students can easily handle the originally messy data and apply it to different fields, visualizing the data and analyzing the underlying mysteries. In addition, using Tableau helps students train their data analysis skills and can also help them solve homework problems. For example, students can apply Tableau to their project studies, helping them analyze data and share insights with others. Therefore, students should learn to use Tableau early, equip themselves, and embrace the challenges brought by the era of big data.

